Storm Tide Pathways TEDx Presentation
“In a technology innovation talk about sea level rise, coastal geologist Mark Borrelli outlines how his team has developed an innovative mapping tool that can tell a community precisely where "street-by-street" flood waters and surging tides will flow. The Storm Tide Pathways method, already rolling out in other communities, is easy enough for anyone to use anywhere.”
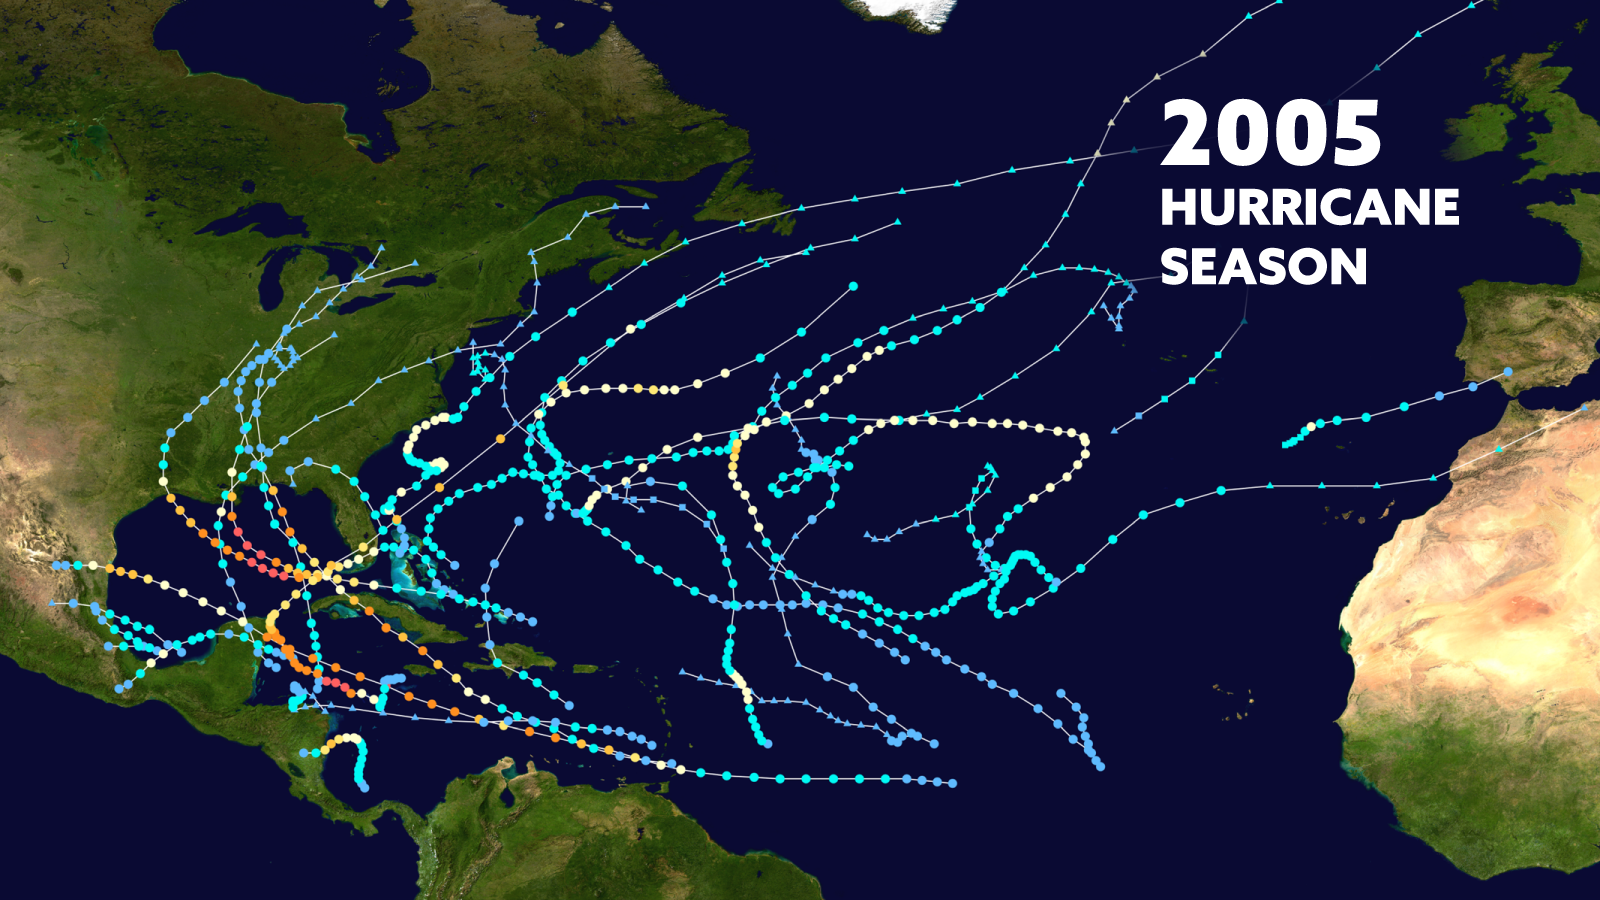
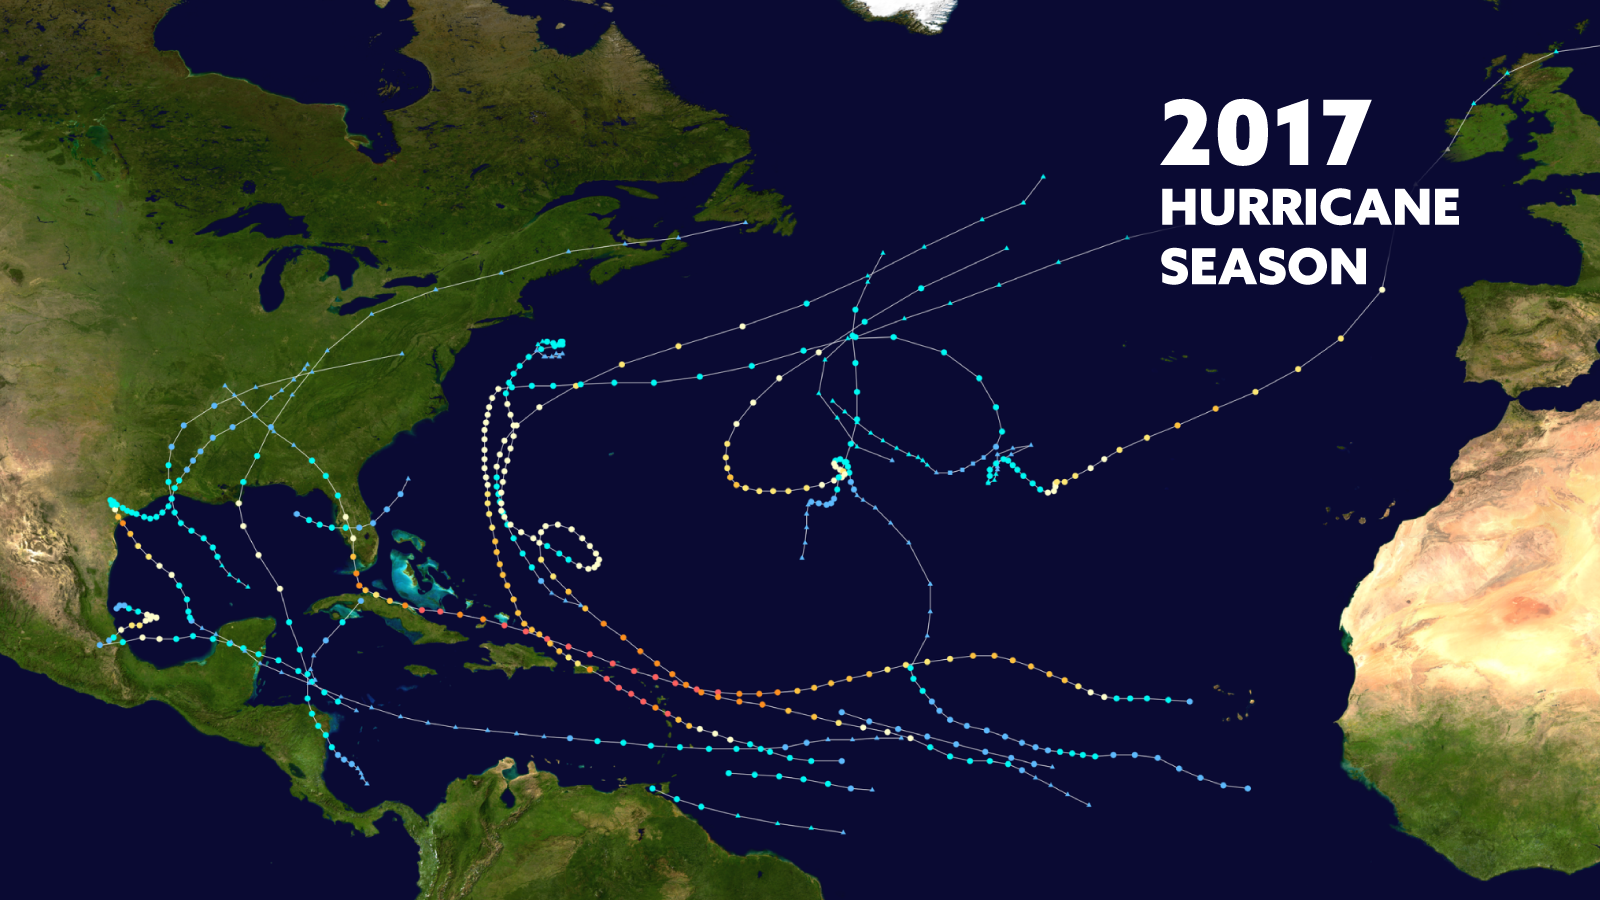
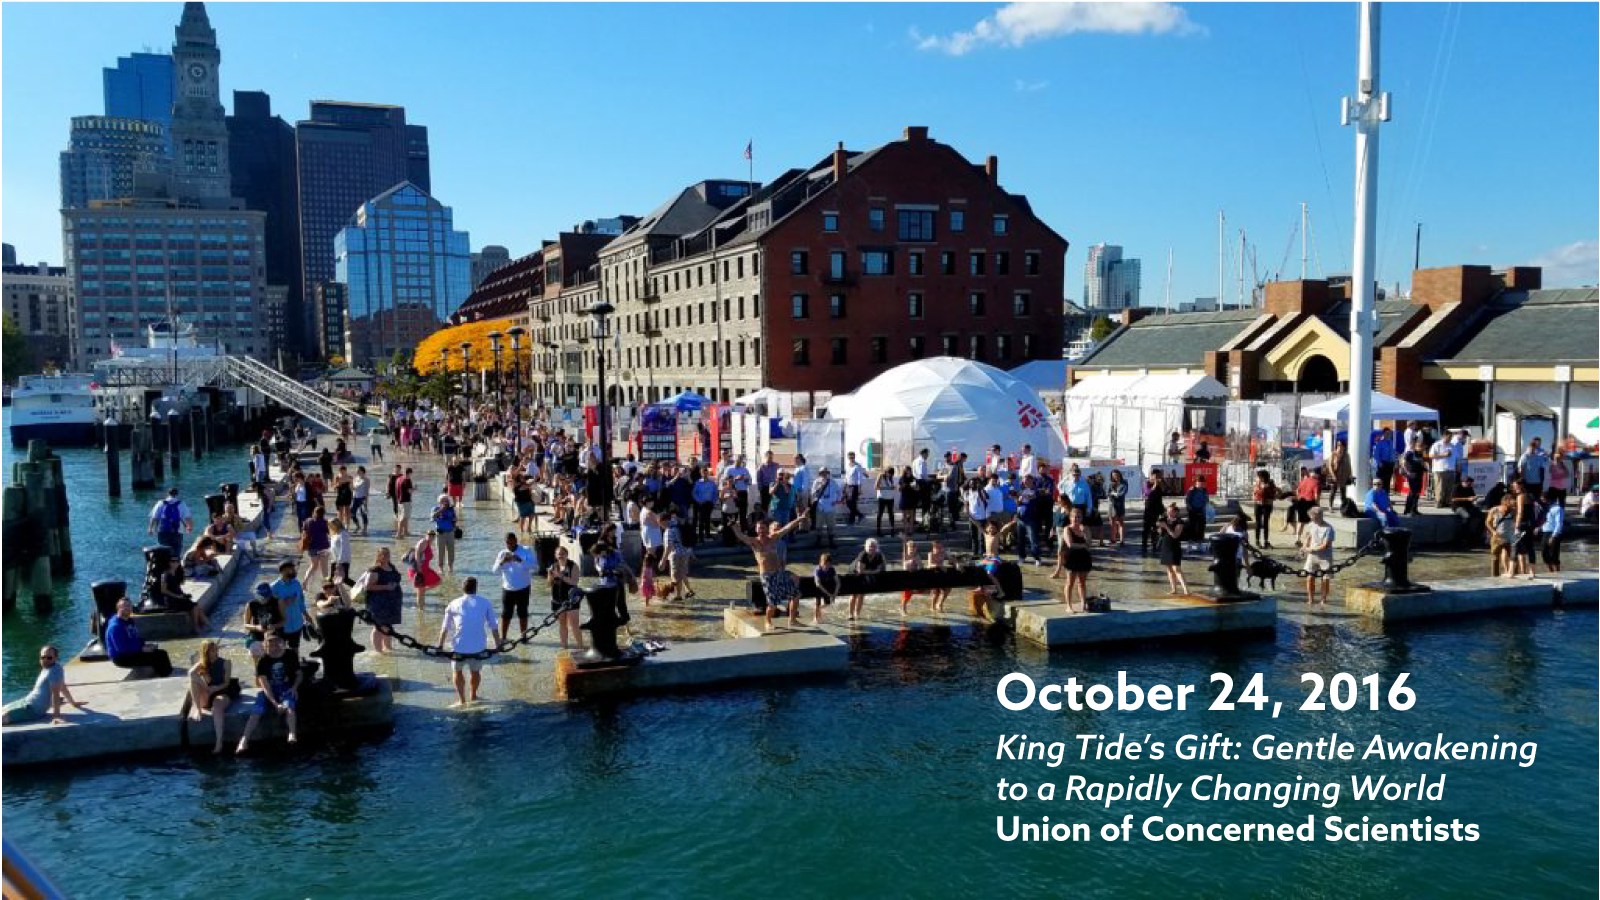
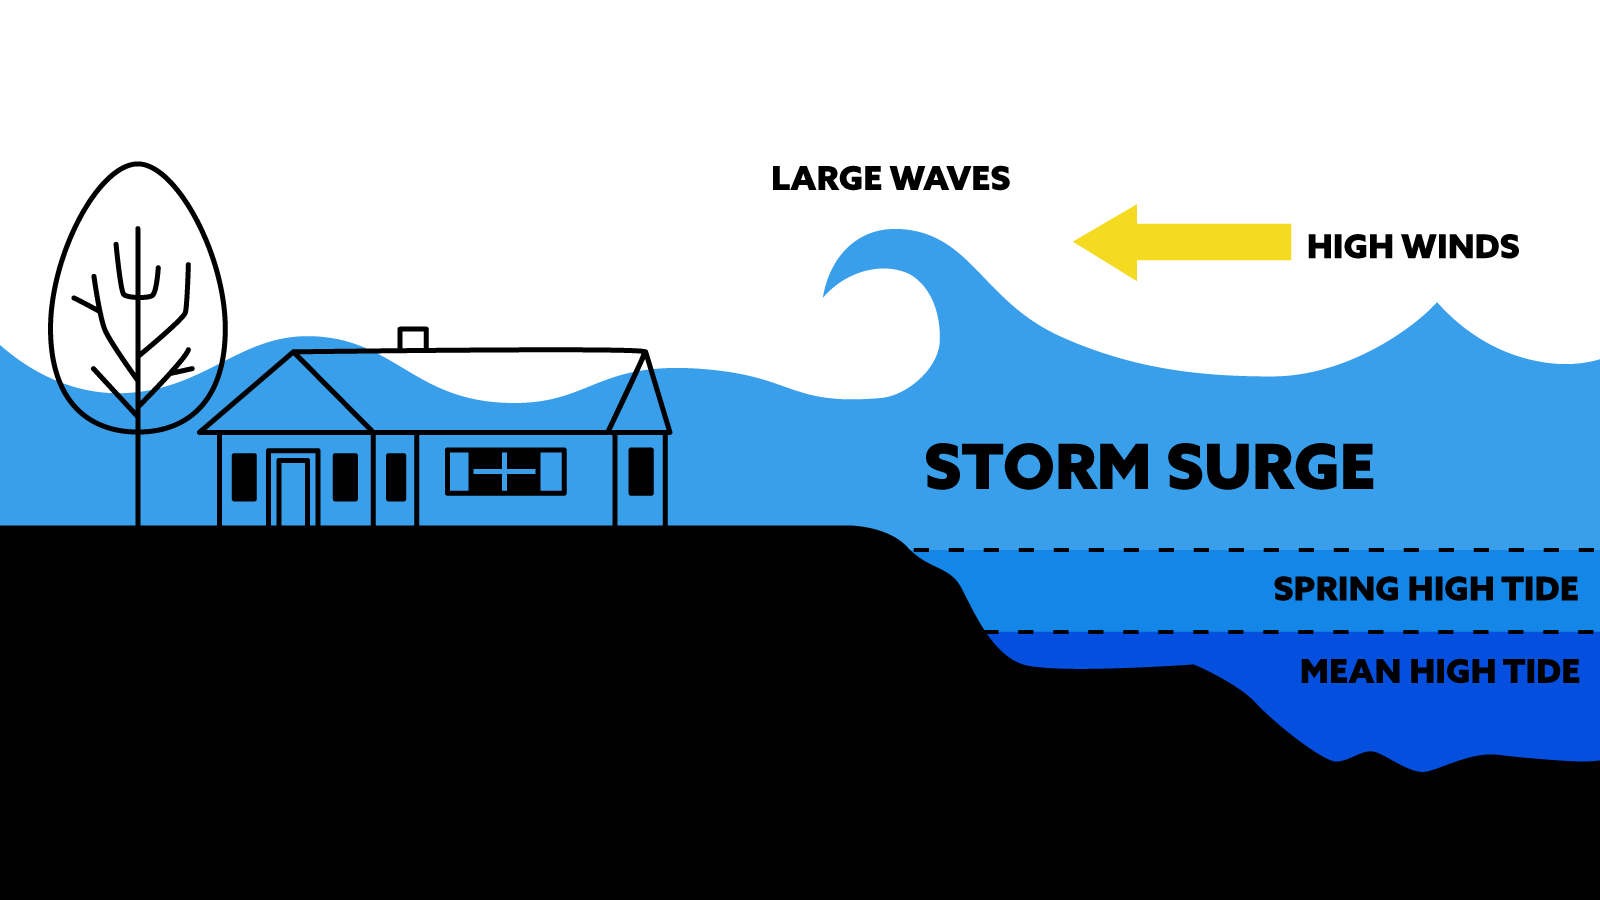
In 2019, I was hired to help Mark Borrelli prepare a presentation for his TEDx Provincetown talk about ‘Storm tide pathways map flooding from storm surge and rising seas’ The main goals I had were two fold. One, to set up the slides in a progressive manner so Mark could step through them and reinforce his lecture through motion. And two, to unify the source images of the presentation through typography. There was also a few visual holes in the presentation that needed to be filled with custom illustration.
Watch the full presentation here!
Client // Software // Year
Mark Borrelli & TEDx Provincetown // Adobe Illustrator & After Effects // 2019
Motion Design
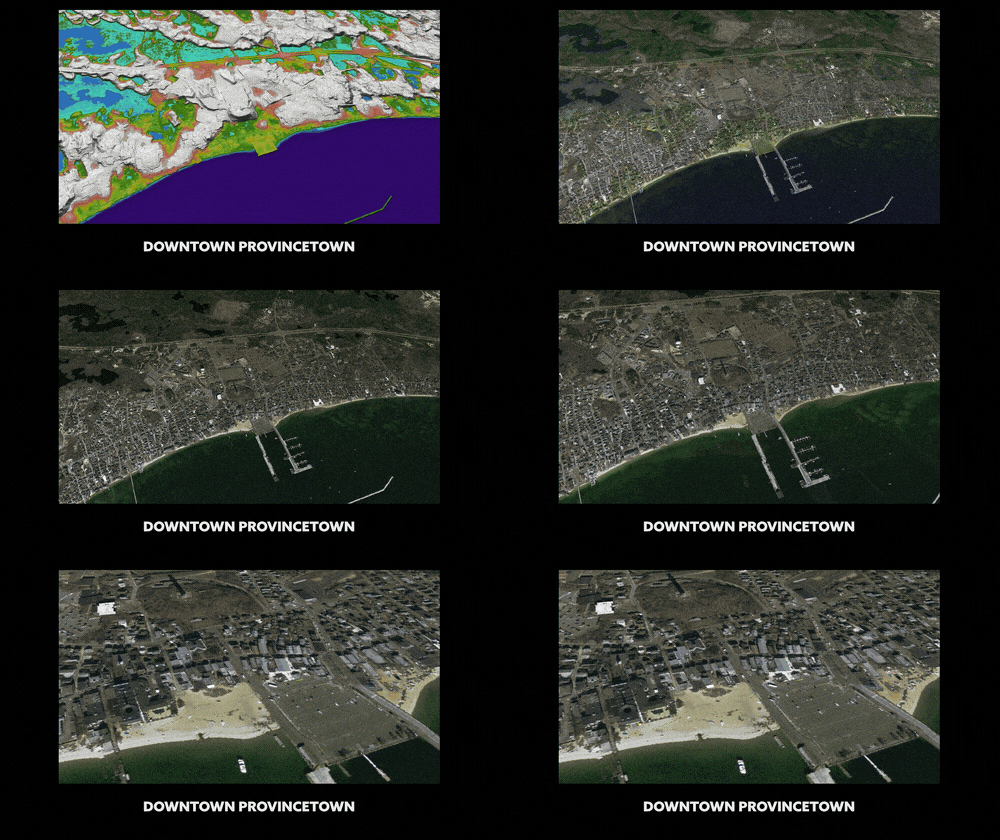
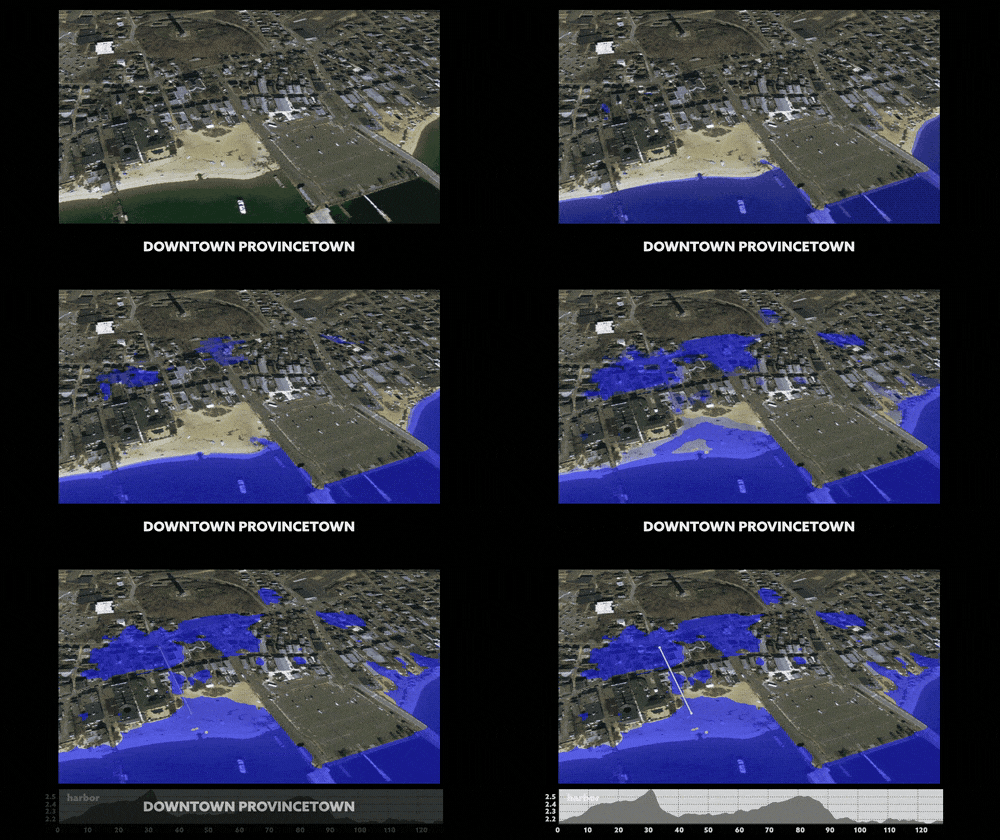
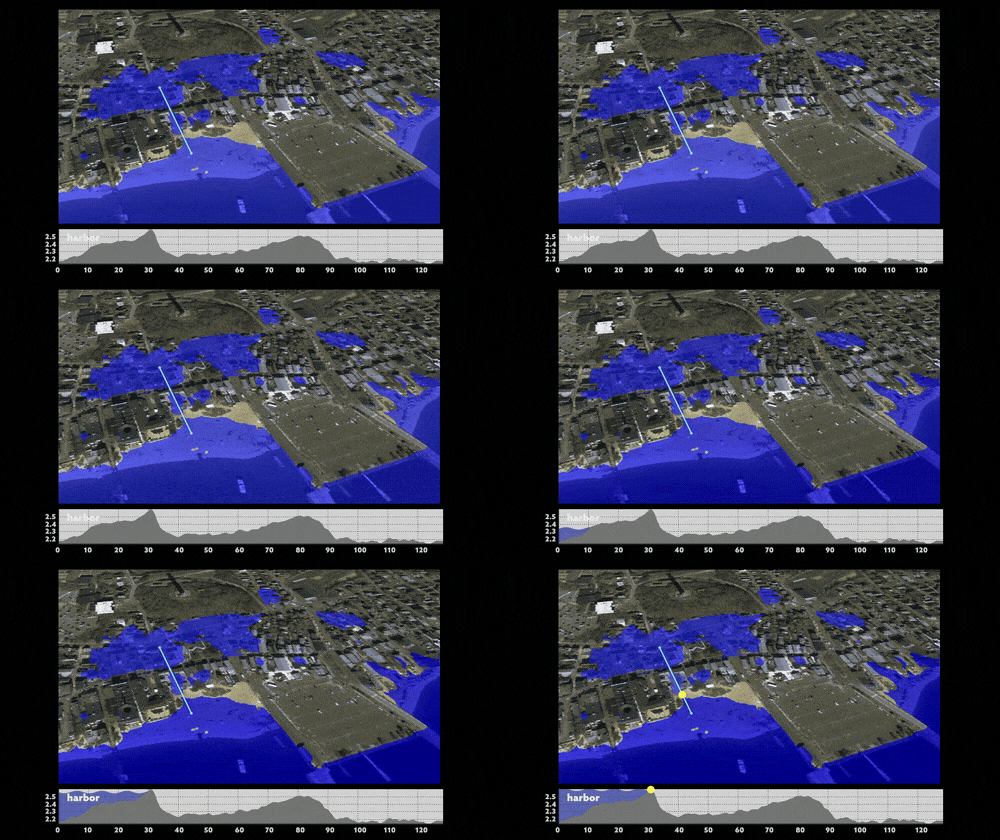
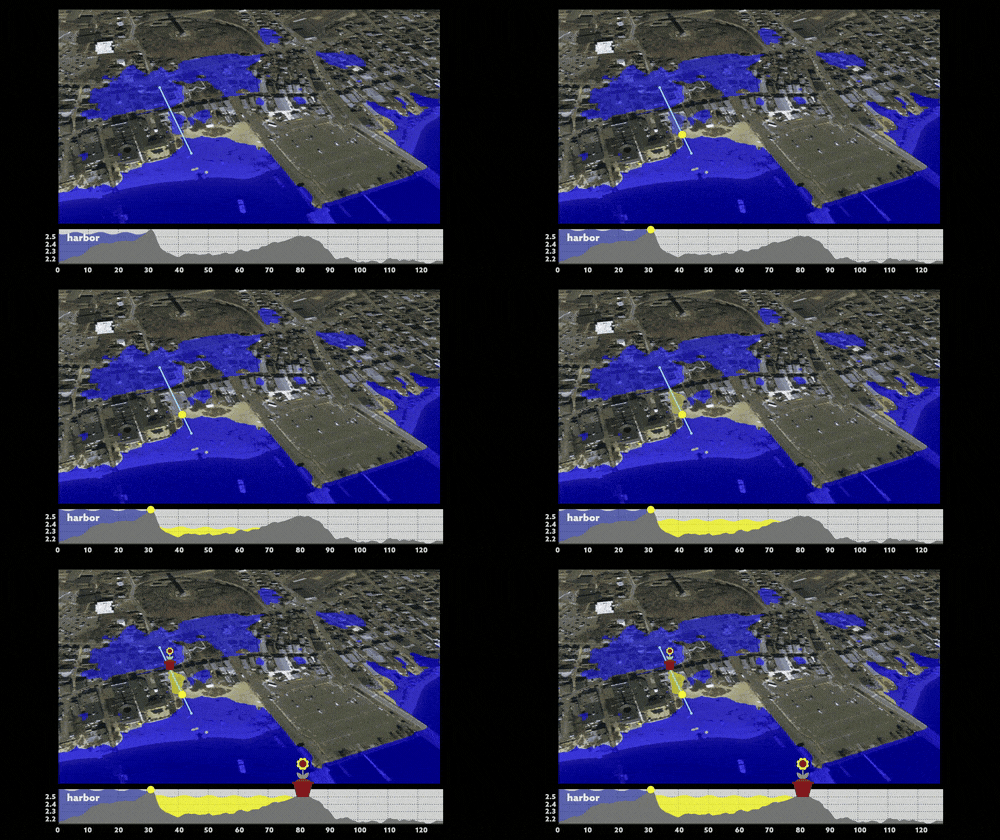
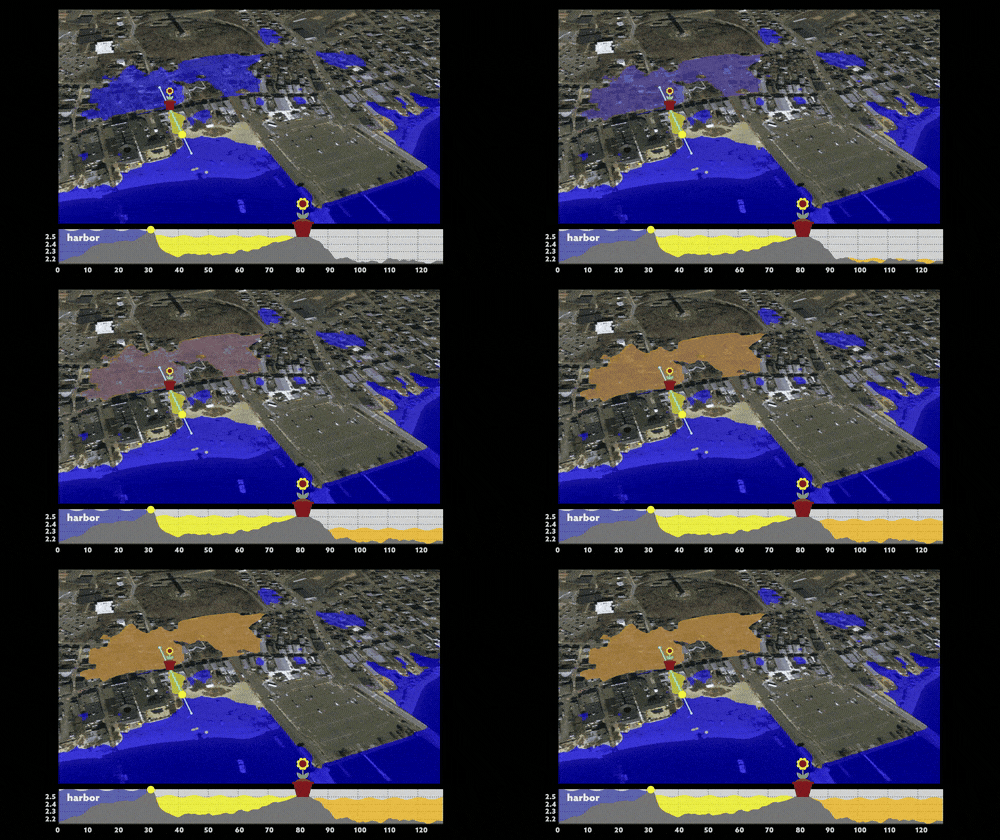
This was one of the more engaging parts of the presentation I worked on. We started with four static images mapping out the different water levels and a graph that depicts the different profiles of the areas that will flood as water level rises.
The animation was broken into parts so that Mark could talk about each stage and progress when he was ready. You can see this in action at 8:24 in the TEDx video.
Slide Design & Typography